Follow us on LinkedIn
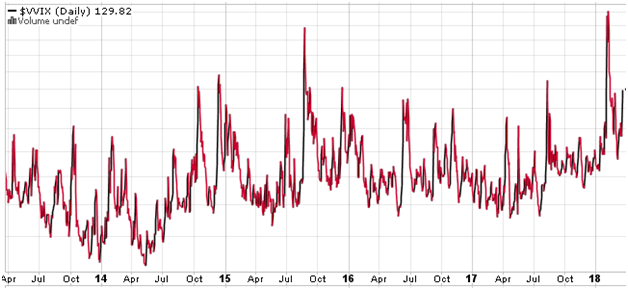
We have written many blog posts about the increase in volatility of volatility. See, for example
Is Volatility of Volatility Increasing?
What Caused the Increase in Volatility of Volatility?
Similarly, last week Bloomberg reported,
The sudden rise in volatility in February and March showed that even with strong growth fundamentals, financial markets remain vulnerable. Since 2008, there have been seven flash crashes followed by sudden recoveries. Volatility has become binary, with markets swinging between periods of shock and calm. The VIX index traded at a median of 16 after the start of QE and at 18 before, but the spikes in volatility have become twice as frequent. It is the equivalent of swapping a stable drizzle rain with many days of scorching sun, at the price of occasional natural disasters. Read more

VVIX (volatility of volatility index) as at March 23 2018. Source: stockcharts.com
The rise of the volatility of volatility increases the chance of a Black Swan event happening. Recently, we presented a study showing that a down day of 4% during a bull market is a very rare event. It happened on February 5, and before that the last time this occurred, it was 18 years ago.
We next counted the number of days when the SP500 dropped 4% or more during a bull market. We defined the bull market as price > 200-Day simple moving average. Since 1970 there have been 5 occurrences, i.e. on average once every 10 years. We don’t know whether this qualifies as a black swan event, but a drop of more than 4% during a bull market is indeed very rare. Read more
Similarly, AQR looked at the February 5 event from the implied/realized volatility perspective.
… As of now (no predictions going forward!) this recent wild period is not super crazy when we look just at volatility itself (it’s high, but not super high vs. history). But, when we look at it as a surprise (by comparing the realized 5-day volatility to the starting VIX) it’s a considerably more shocking event, though still not unprecedented. Similar events have occurred five or so times in the 1990 – present history (again, see the above figure). Finally, when just using the simple method of targeting constant volatility that we employ here, this recent surprise swoon was, as we’d expect, pretty bad for volatility targeters. But, over the longer term, volatility targeting, even the super simple volatility targeting our toy risk-model employs, may, on average, deliver more downside stability than not volatility targeting and implicitly letting the market dictate the volatility of your investment. Read more
Again, from the implied/realized volatility point of view, the recent event was a rare occurrence, though not unprecedented. In times like this, risk management is more important than ever.
Further questions
What's your question? Ask it in the discussion forum
Have an answer to the questions below? Post it here or in the forum

Caldwell got his start snapping pictures of his high-school classmates with a Razr flip phone.


U.S. District Judge Richard Gergel lengthened the sentence because the victims in the case were “the most needy, vulnerable people.”
