An option is a financial contract that gives you a right, but not an obligation to buy or sell an underlying at a future time and at a pre-determined price. Specifically,
… an option is a contract which gives the buyer (the owner or holder of the option) the right, but not the obligation, to buy or sell an underlying asset or instrument at a specified strike price on a specified date, depending on the form of the option. The strike price may be set by reference to the spot price (market price) of the underlying security or commodity on the day an option is taken out, or it may be fixed at a discount or at a premium. The seller has the corresponding obligation to fulfill the transaction – to sell or buy – if the buyer (owner) “exercises” the option. An option that conveys to the owner the right to buy at a specific price is referred to as a call; an option that conveys the right of the owner to sell at a specific price is referred to as a put. Read more
Excellent textbooks and papers have been written on options pricing theory; see for example Reference [1]. In this post we are going to deal with practical aspects of pricing a European option. We do so through a concrete example.
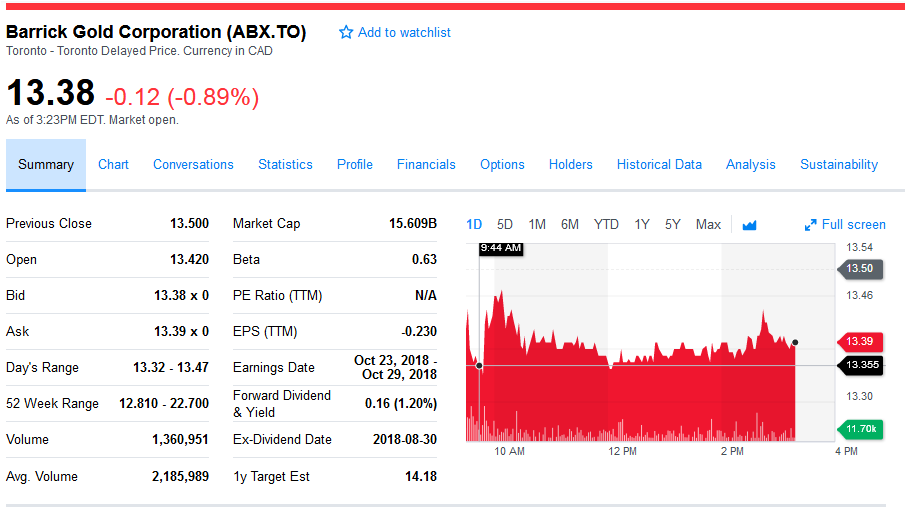
We’re going to price a put option on Barrick Gold, a Canadian mining company publicly traded on the Toronto Stock Exchange under the symbol ABX.TO. For this exercise, we assume that the option is of European style with a strike price of $13. (American style option will be dealt with in the next installment). The option expires in 3 years, and the valuation date is August 22, 2018.

Barrick Gold mining financial data as at Aug 23 2018
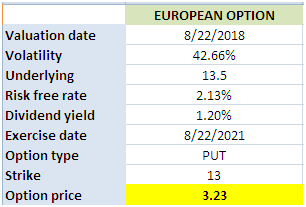
The important input parameters are:
Volatility
In this example we are going to use historical volatility. We retrieve the historical stock data from Yahoo finance. We then proceed to calculate the daily returns and use them to determine the annual volatility. The resulting volatility is 43%. Detailed calculation is provided in the accompanying Excel workbook.
Stock price
The stock price is also obtained from Yahoo finance. It is 13.5 as at the valuation date.
Dividend
The dividend yield is obtained from Yahoo finance. It is 1.2%. Note that for illustration purposes we use continuous instead of discrete dividend.
Interest rate
The risk-free interest rate is retrieved from Bank of Canada website. Since the tenor of the option is 3 years, we’re going to use the 3-year benchmark yield. It is 2.13% as at the valuation date.
After obtaining all the required input data, we use QuantlibXL to calculate the price of the option. The calculator returns a price of $3.21. The picture below presents a summary of the valuation inputs and results.

European option valuation in Excel
In the next installment, we’re going to present an example for American option.
Related post: Valuation of European and American Options-Derivative Pricing in Python
References
[1] Hull, John C. (2005), Options, Futures and Other Derivatives (6th Ed.), Prentice-Hall
Further questions
What's your question? Ask it in the discussion forum
Have an answer to the questions below? Post it here or in the forum


The WSJ Dollar Index was down 0.4% to 98.73 — down for three of the past four trading days.
