Regression analysis consists of a set of statistical methods often used to estimate the relationship between two variables, one independent and the other dependent. It is a useful tool in several cases, especially for modeling and forecasting. Mostly used in statistics, regression analysis can also be beneficial in finance and investing.
When it comes to regression analysis, there are several variations that one can use. Among these, one is the linear regression analysis.
What is Linear Regression?
Linear regression consists of analyzing two different variables to find a single, linear relationship. Usually, investors use it to determine the relationship between price and time. In this case, time is the independent variable, while the price is a dependent variable that fluctuates with time. Through regression analysis, investors can identify the highest and lowest price points, entry price, exit prices, and stop-loss price.
What are some assumptions for Linear Regression?
There are a few assumptions that investors need to make in order to determine the relationship between two variables in linear regressions. Firstly, investors must assume there are two variables, one of which is independent and the other dependent. For the independent variable, investors must consider it as truly independent. Similarly, investors must also assume the data does not consist of any different error variances.
Lastly, investors must also assume a correlation between variables, which means the error terms of each variable must be uncorrelated. In case any of these assumptions are not true, the linear regression analysis will fail.
How to perform linear regression in Excel?
Linear regression is complicated for investors, as it is a statistical tool. Without the proper knowledge, they cannot perform it. However, with the help of Excel, the process becomes much straightforward. The best way to perform linear analysis using Excel is through the use of charts.
For example, an investor wants to perform linear regression on the price of a stock. They have prepared the following information based on historical prices from the stock market.
| Year | Stock price ($) |
| 2015 | 89.5 |
| 2016 | 93.6 |
| 2017 | 95.7 |
| 2018 | 96.9 |
| 2019 | 102.7 |
| 2020 | 104.6 |
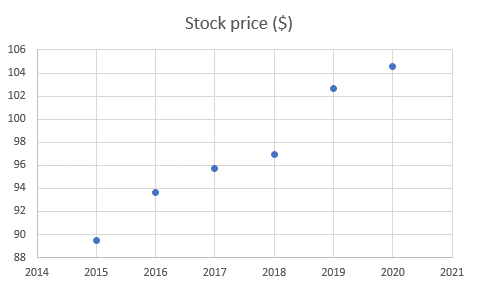
In this case, the independent variable is the year, and the dependent variable is the stock price. Using a chart, the investor can see the changes in the dependent variable in relation to the independent variable. The best chart for this purpose is a scatter chart.
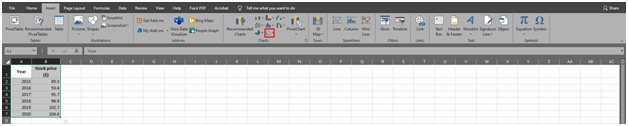
The data must be selected or highlighted to create a scatter chart. From there, the option to create a scatter chart is available under the ‘Insert’ tab in Excel 2019. It is as below.
It will produce a chart similar to the one below.
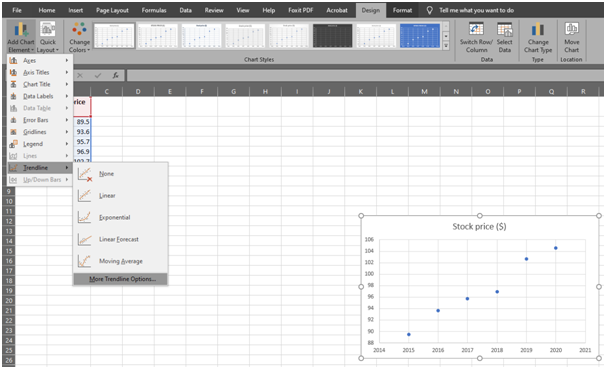
The next step is to generate a trendline. The option to create a trendline is online available if the chart is selected. The trendline option becomes available by selecting the chart and going to the tab and clicking on ‘Add chart element’. The easiest way to create a trendline is to use the ‘Linear’ option from the ‘Trendline list’.
However, for Linear Regression, it is critical to click the ‘More Trendline Options’ option, as shown below.
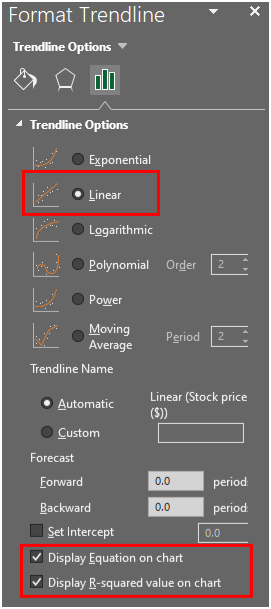
This option will open a new sidebar on the right. By selecting the ‘Linear’ option from the bar, the chart will display a linear line. From there, the options ‘Display Equation on chart’ and ‘Display R-squared value on chart’ will give information related to linear regression, as follows.
It will give information related to linear regression on the chart. The final chart will look similar to the following.
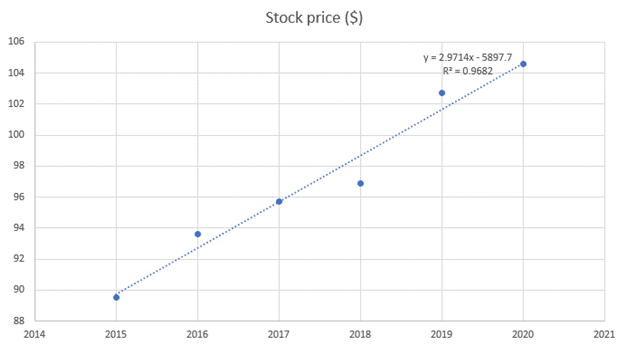
In the above equation, ‘y’ signifies the linear regression of the given data. The ‘R2‘ shows the percentage of variance in the dependent variable that the independent variable explains collectively.
Conclusion
Linear regression is a technique used to determine the relationship between two variables. There are some assumptions that investors need to make to use it. The best way to perform linear regression in Excel is through the use of the charts feature, as explained above.
Further questions
What's your question? Ask it in the discussion forum
Have an answer to the questions below? Post it here or in the forum
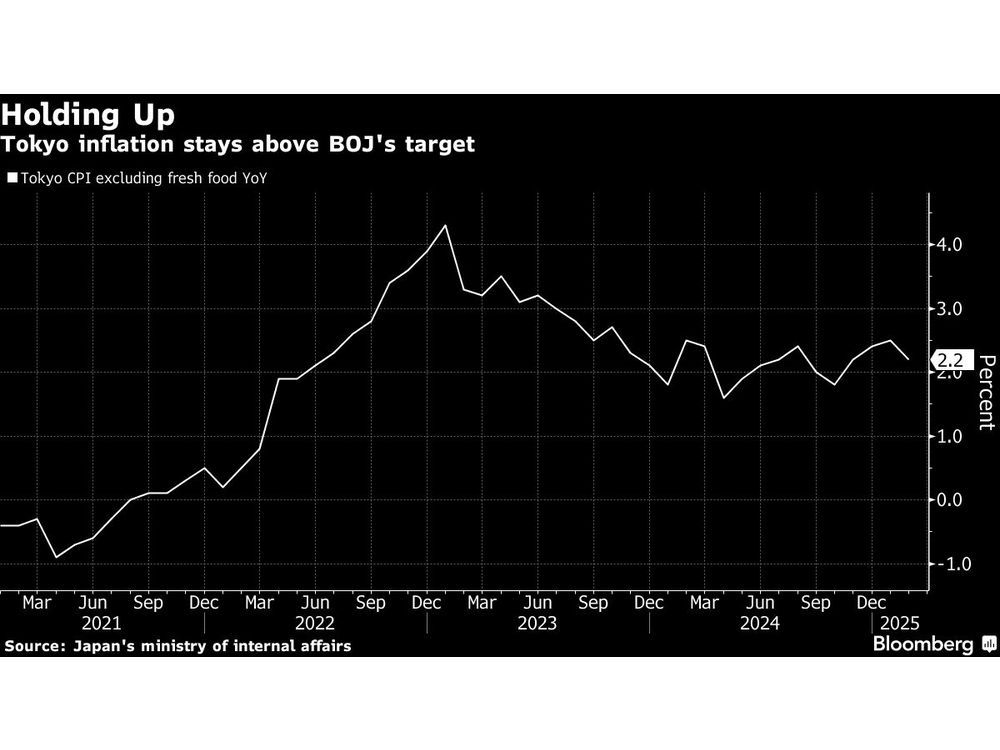
Inflation in Tokyo slowed more than expected as government subsidies meant to offset energy costs distorted readings, a result that isn’t likely to deter the central bank from considering more hikes to its benchmark interest rate.

VANCOUVER, British Columbia, Feb. 27, 2025 (GLOBE NEWSWIRE) — Entrée Resources Ltd. (TSX:ETG; OTCQB:ERLFF – the “Company” or “Entrée”) is pleased to provide analytical results for eleven underground diamond drill holes (“DDH”) completed in 2022 – 2024 at the Hugo North Extension (“HNE”) deposit on…

Innovative model will preserve and strengthen community banking powered by values-driven financial services TERRITORIES OF MUSQUEAM, SQUAMISH, TSLEIL-WAUTUTH, K’ÒMOKS, KLAHOOSE, AND TLA’AMIN NATIONS, Feb. 27, 2025 (GLOBE NEWSWIRE) — Vancity and First Credit Union are excited to share their intention to explore a potential merger.…