Follow us on LinkedIn
What is a Time Series?
A time-series represents a collection of observations obtained through repeated measurements. Usually, these are in successive order. Time series data can come from anywhere. As long as the data is quantifiable over time, it can be a part of a time series. Time series analysis is prevalent in many fields, especially finance.
A time series can come from any variable that changes over time. In finance, investors may use it to keep track of a security’s price over a period, whether short or long. The details of a time series may differ according to the available data or the needs of investors.
What is a Time Series Analysis?
Time series analysis is useful in measuring the variation in a dataset over a specific time. Essentially, time series analysis involves the study of data collected in a time series. The objective of this type of analysis may differ according to the users’ needs. Usually, however, time series analysis is prevalent for identifying patterns and trends.
Time series is crucial for finance and investing. However, it also has applications in other fields, such as economics. The process for time series analysis in other fields is similar. Whenever users have a data set with historical values, they can analyze it to identify any associated patterns and predict future positions. However, there might be some limitations that may come with it.
How to perform Time Series Analysis in Excel?
As mentioned, if investors have a data set that records values at certain intervals, they can perform a time series analysis. They can use Excel to perform a time series analysis with their given data set. It is possible to use Excel in analyzing any given set as long as the data is quantifiable.
For example, a company, Red Co., has the following profits over some years.
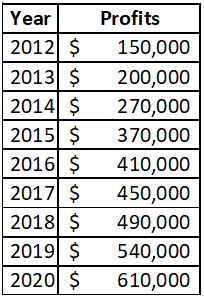
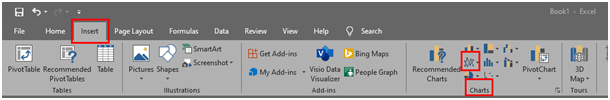
The data in the above table consists of Red Co.’s annual profits for eight years. It is possible to perform time-series analysis on the data in Excel through charts. The best option for this analysis is by using a line chart. It is available under the “Insert” tab and “Charts” section.
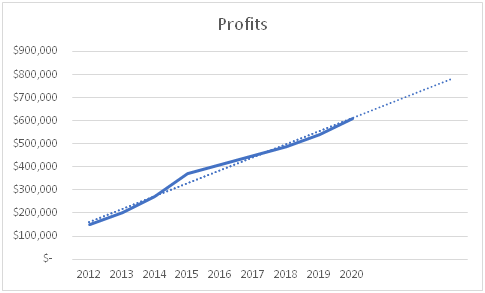
The line chart will appear like below.

From there, it is possible to enable a trendline using the “Design” tab under “Add Chart Element”. Within the dropdown, the option is available in the “Trendline”. The chart will look as below.

That is the line that shows the trend for the data. However, users can use the trendline feature to extrapolate the data. The option is available under the same “Trendline” list but choosing “More Trendline Options”. A new tab will open that looks as below.

Using the forecast feature under those options, it is possible to go forward and backward using the given data. For example, a chart that forecasts three periods in the future will look as follows.
Users can also choose other types of trend lines, such as Moving Average for further analysis.
Conclusion
A time-series represents a sequence of a quantified dataset in successive order. Time series analysis a tool used to measure the change in a dataset over a specific time. It is possible to perform time series analysis in Excel with the help of charts and trendlines. Users can also use it to extrapolate the data into future periods.
Further questions
What's your question? Ask it in the discussion forum
Have an answer to the questions below? Post it here or in the forum
Meta rolled back January 6-era restrictions on former President Donald Trump's social media accounts ahead of the Republican National Convention.


June saw 75 filings, up from 62 in May and above the pandemic-era peak of 74 in July 2020, according to S&P Global Market Intelligence.
Credit markets are breathing a sigh of relief after inflation data showed price pressures are cooling broadly, but a weakening economy poses fresh risks to corporate debt.