Follow us on LinkedIn
Correlation analysis is a tool used to test the relationship between various variables, either quantitative or categorical. It measures how these variables affect each other. Through analyzing the correlation between different variables, making predictions or estimates on future behaviours becomes less complex.
When it comes to investing and finance, correlation analysis is the study of how two securities fluctuate in relation to each other. Correlation is an important concept used in advanced portfolio management. Usually, correlation analysis consists of establishing a ‘correlation coefficient’ which ranges between -1.0 and +1.0. Investors can also determine a benchmark index and perform correlation analysis with respect to it.
What does Correlation signify?
Correlation signifies how strong the relationship between two quantitative variables through the correlation coefficient. As mentioned above, the correlation coefficient can range from -1.0 to +1.0. A +1.0 coefficient shows a perfect positive correlation. It means that the relationship between the two securities is the strongest. When one security fluctuates, the other security will also follow the exact trend in the same direction.
In contrast, the -1.0 correlation signifies a perfect negative correlation. Here, the correlation is in the opposite direction. Therefore, when one security fluctuates, the other security will also have the same fluctuation but in the opposite direction. For example, if one security goes up, the other will go down. Lastly, a zero correlation shows no correlation at all.
How to calculate the Correlation Coefficient?
Investors can use the formula below to calculate the correlation between two variables.
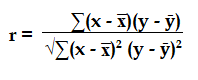
In the above formula, ‘r’ represents the correlation coefficient. ‘x’ denotes the value of the first variable in consideration. ‘x̅’ indicates the average observations of the first variable. Similarly, ‘y’ and ‘ȳ’ show the value of the second variable and its average observations, respectively.
Investors need to follow a few steps when calculating the correlation coefficient. Firstly, they need to obtain a data sample with two variables, which will represent ‘x’ and ‘y’. Similarly, they need to calculate the average or mean for both variables. These will constitute ‘x̅’ and ‘ȳ’. Then they can subtract the mean values from both variables for the formula.
After subtracting both means from their respective variables, investors will need to multiply the residual amounts with each other and find the sum of these multiplications. For the denominator, they will also need to square both of them before calculating the sum. After calculating it, they can square root it and obtain the value of the denominator. Finally, they can divide the nominator by the denominator to calculate the correlation coefficient.
Example
An investor wanting to track the performance of a specific index, for example, Nasdaq Composite, wants to calculate if investing in a company will increase their systematic risk. The investor calculates the correlation coefficient between the stock and the index to be +0.90. It means that the stock has a high positive correlation with the index.
Based on this, the investor understands that the high positive correlation will result in an increase in the systematic risk of their portfolio.
Conclusion
Correlation analysis is the method of testing the relationship between various variables. In investing, investors use it to calculate the correlation of various securities or stocks. Usually, they may calculate the correlation coefficient between a stock and a specific index.
Further questions
What's your question? Ask it in the discussion forum
Have an answer to the questions below? Post it here or in the forum
The Princess of Wales will present the trophy to either last year's winner, Carlos Alcaraz, or seven-time Wimbledon champion, Novak Djokovic.