Pair trading, or statistical arbitrage, is one of the oldest forms of quantitative trading. In this post, we are going to present some relevant statistical tests for analyzing the Australia/Canada pair. We chose this pair because these countries’ economies are tied strongly to the commodity sector, therefore they share similar characteristics and could be a good candidate for pair trading.
We first downloaded the data from Yahoo Finance. We downloaded 10 years of data of EWA and EWC, which are the Exchange Traded Funds (ETF) associated with Australia and Canada, respectively. We then utilized Python to plot the data and perform statistical tests.
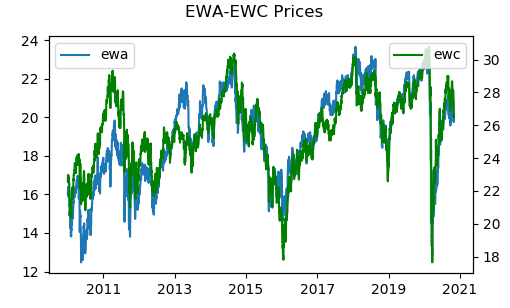
The chart below shows the price time series. Visually, these 2 country ETFs move in a similar fashion, more or less.

We next calculated the correlation of returns and obtained 0.7908. The high correlation makes the pair a good candidate for statistical arbitrage.
We then determined the price spread and performed the Augmented Dicker Fuller test for cointegration.
In statistics and econometrics, an augmented Dickey–Fuller test (ADF) tests the null hypothesis that a unit root is present in a time series sample. The alternative hypothesis is different depending on which version of the test is used, but is usually stationarity or trend-stationarity. It is an augmented version of the Dickey–Fuller test for a larger and more complicated set of time series models.
The augmented Dickey–Fuller (ADF) statistic, used in the test, is a negative number. The more negative it is, the stronger the rejection of the hypothesis that there is a unit root at some level of confidence. Read more
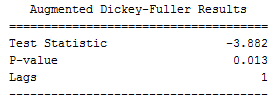
The picture below shows the test results. The p-value is less than 0.05; therefore the pair is cointegrated at the 95% confidence level.

Finally, we performed the Phillips-Perron test for cointegration on the spread.
In statistics, the Phillips–Perron test (named after Peter C. B. Phillips and Pierre Perron) is a unit root test. That is, it is used in time series analysis to test the null hypothesis that a time series is integrated of order 1… Like the augmented Dickey–Fuller test, the Phillips–Perron test addresses the issue that the process generating data for yt might have a higher order of autocorrelation than is admitted in the test equation—making yt-1 endogenous and thus invalidating the Dickey–Fuller t-test. Read more
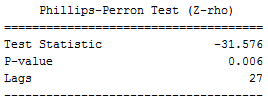
The picture below shows the test results. The p-value is less than 0.05; therefore the pair is cointegrated at the 95% confidence level.

In the next installment, we will implement a trading strategy using this cointegrated pair.
To download the accompanying Excel workbook or Python program for this post:
1. Subscribe to the newsletter. If you're already a subscriber, go to the next step
2. Once subscribed, refer a friend
After completing these steps, you’ll gain access to the file for this post, along with files for a dozen other posts.
Further questions
What's your question? Ask it in the discussion forum
Have an answer to the questions below? Post it here or in the forum


