In the previous installment, we presented a description of the Model Portfolio Theory and provided a concrete example in Python. We also explained the concept of an Efficient Frontier and provided a visual presentation of it. Recall that,
… the efficient frontier (or portfolio frontier) is an investment portfolio which occupies the “efficient” parts of the risk–return spectrum. Formally, it is the set of portfolios which satisfy the condition that no other portfolio exists with a higher expected return but with the same standard deviation of return (i.e., the risk). The efficient frontier was first formulated by Harry Markowitz in 1952.
A combination of assets, i.e. a portfolio, is referred to as “efficient” if it has the best possible expected level of return for its level of risk (which is represented by the standard deviation of the portfolio’s return). Here, every possible combination of risky assets can be plotted in risk–expected return space, and the collection of all such possible portfolios defines a region in this space. In the absence of the opportunity to hold a risk-free asset, this region is the opportunity set (the feasible set). The positively sloped (upward-sloped) top boundary of this region is a portion of a hyperbola and is called the “efficient frontier”. Read more
In this follow-up post, we are going to search for the optimal portfolio, i.e. one that has the highest risk-adjusted return. To do so, we will maximize the portfolio’s Sharpe ratio. The Sharpe Ratio is a financial metric that helps investors determine the return of an investment compared to its risk. It presents the average return that investors earn above the risk-free rate per unit of volatility or risk. The higher the Sharpe Ratio of a portfolio, the better it is in terms of risk-adjusted return.
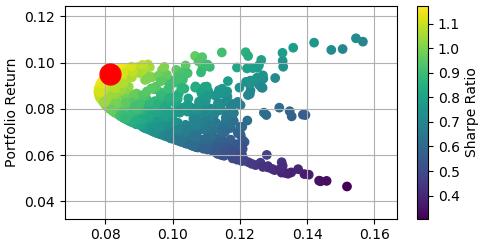
Our hypothetical portfolio consists of 3 Exchange Traded Funds: SPY, TLT, and GLD which track the S&P500, long-term Treasury bond, and gold respectively. We downloaded 10 years of data from Yahoo Finance and utilized a Python program to search for the optimal portfolio. The figure below shows the Efficient Frontier along with the optimal portfolio (depicted by the red dot).

The figure below shows the optimal portfolio’s composition, return, volatility, and the Sharpe ratio.
![]()
To download the accompanying Excel workbook or Python program for this post:
1. Subscribe to the newsletter. If you're already a subscriber, go to the next step
2. Once subscribed, refer a friend
After completing these steps, you’ll gain access to the file for this post, along with files for a dozen other posts.
Further questions
What's your question? Ask it in the discussion forum
Have an answer to the questions below? Post it here or in the forum


thanks for excellent article .. please note that the twitter 7 Facebook sharing links are not working
It should be working now.