In a previous post, we presented a method for calculating a stock beta and implemented it in Python. In this follow-up post, we are going to implement the calculation in Excel. We continue to use Facebook as an example.
What is beta?
Recall that,
In finance, the beta (market beta or beta coefficient) is a measure of how an individual asset moves (on average) when the overall stock market increases or decreases. As such, beta is a useful measure of the contribution of an individual asset to the risk of the market portfolio when it is added in small quantity. Thus, beta is referred to as an asset’s non-diversifiable risk, its systematic risk, market risk, or hedge ratio. Beta is not a measure of idiosyncratic risk. Read more
Formula for calculating stock beta
We utilize the following equation to calculate the stock beta,
![]()
where
- rS is the stock return,
- rM is the market return,
- Cov denotes the return covariance and,
- Var denotes the return variance.
Excel workbook for calculating stock beta
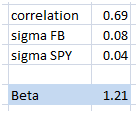
We downloaded 5 years of monthly Facebook data from Yahoo Finance. We implemented the above equation in Excel and obtained a beta of 1.21

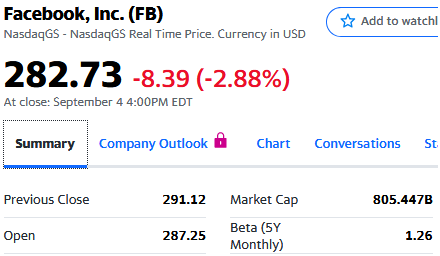
The picture below shows Facebook beta calculated by Yahoo Finance. It is 1.26. Our result agrees well with Yahoo’s result, although there is a small difference.

Let us know what you think where the difference comes from.
To download the accompanying Excel workbook or Python program for this post:
1. Subscribe to the newsletter. If you're already a subscriber, go to the next step
2. Once subscribed, refer a friend
After completing these steps, you’ll gain access to the file for this post, along with files for a dozen other posts.
Further questions
What's your question? Ask it in the discussion forum
Have an answer to the questions below? Post it here or in the forum


I tried to replicate it and I think it is bc Yahoo calculates Beta to the latest quarterly results (which makes sense wrt to their other metrics)
Also I think they take the adj closing prices from the last previous 5 years i.e. 60 values which then is only 59 changes.
Thanks, good point.
I also recently noticed that Yahoo monthly closing prices are not the same as the closing prices of the last day of the month. Probably Yahoo uses volume weighted averages in its calculation of monthly prices