Linear regression is a widely used prediction technique in finance. Linear regression can estimate the relationship between a dependent variable (such as stock price) and one or more independent variables (like market indices or economic indicators). This approach is particularly useful in predicting trends, asset prices, and risk factors. However, while it is effective for identifying linear relationships, it may be limited when handling complex or non-linear data patterns, which are also common in financial markets.
Reference [1] proposed using polynomial regression models to predict stock price movements. Specifically, it applied two-, three-, and four-degree polynomial regression models to forecast stocks’ daily movements, and used two standard deviations from the regression model to generate trading signals. The trading strategy works as follows,
- When the stock’s closing price crosses above the upper band, the system purchases the stock at the opening price on the next trading day, thus initiating a long position.
- When the closing price touches the lower band, the system sells the stock at the opening price the following day, closing the long position.
The author pointed out,
In this research, we explored whether a trading system based on polynomial moving regression bands (MRBs) could be effectively applied to Nasdaq100 stocks to trade profitably. We designed three fully automated trading systems using polynomial MRBs of degrees two to four and tested their performance on daily stock data from early 2017 to the end of March 2024. To limit the overfitting problem, we employed several strategies: we used lower-degree polynomials to avoid unnecessary complexity, implemented early stopping during model training to prevent the models from becoming too specialized to the training data, and conducted random searches to find the optimal balance between model complexity and performance. Our results indicated that all three models achieved, on average, a positive net profit (NP), with a percent of profitable trades (PP) exceeding 50% and a profit factor (PF) greater than 1, demonstrating that the behavior of Nasdaq100 stocks can be effectively modeled using polynomial regression without overfitting. Among the models, Model 3, which employed a fourth-degree polynomial MRB system, performed the best, achieving the highest average NP of USD 162.73 and exhibiting a superior risk profile with the lowest average loss (USD 95.52), highest minimum PP (41.51%), and highest minimum PF (0.55). These findings suggest that carefully designed polynomial MRB-based trading systems, which mitigate overfitting through model selection and validation techniques, can successfully capture stock price trends and be used to trade profitably in fully automated systems.
In short, using higher-order regression models proved effective.
While this idea has its merits, it’s worth noting that as the degree of the polynomial increases, the risk of overfitting also rises. To mitigate this risk, rigorous out-of-sample testing is essential. Although the author claimed that out-of-sample validation was performed, the description of this procedure was too brief. More details on the out-of-sample validation would be desirable.
Let us know what you think in the comments below or in the discussion forum.
References
[1] Gil Cohen, Polynomial Moving Regression Band Stocks Trading System, Risks 12: 166, 2024
Further questions
What's your question? Ask it in the discussion forum
Have an answer to the questions below? Post it here or in the forum
RBC says these worrying indicators are worth keeping an eye on
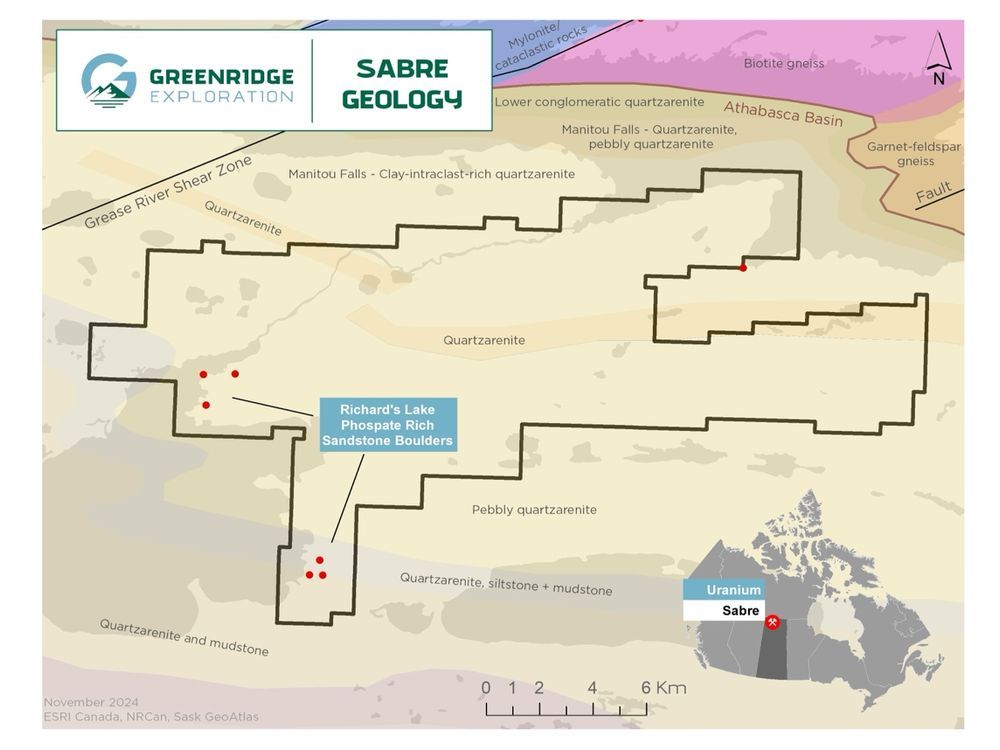
VANCOUVER, British Columbia, March 13, 2025 (GLOBE NEWSWIRE) — Greenridge Exploration Inc. (“Greenridge” or the “Company”) (CSE: GXP | FRA: HW3 | OTCQB: GXPLF), is pleased to announce the engagement of Expert Geophysics Surveys Inc. (“EGS”) to carry out a helicopter-borne Mobile MagnetoTellurics System (“MobileMT”)…

VANCOUVER, British Columbia, March 13, 2025 (GLOBE NEWSWIRE) — MAX Power Mining Corp. (CSE: MAXX; OTC: MAXXF; FRANKFURT: 89N) (“MAX Power” or the “Company”) is pleased to announce that it has engaged Ms. Monita Faris as the Company’s new Corporate Secretary. Based in Vancouver, Ms.…
The order replenishes existing SKUs, and NEXE is working on new blends for EKOCUPS to enhance its product offerings WINDSOR, Ontario, March 13, 2025 (GLOBE NEWSWIRE) — NEXE Innovations Inc. (“NEXE”, the “Company”, “we” or “our”) (TSX.V: NEXE) (Frankfurt: NX5) (OTC: NEXNF), a compostable and…
Plug penetrates the industrial supplier market with new agreement by demonstrating a sustainable option to lead acid batteries SLINGERLANDS, N.Y., March 13, 2025 (GLOBE NEWSWIRE) — Southwire, a leading North American manufacturer of wire and cable, will tap Plug Power Inc. (NASDAQ: PLUG), a global…