In a previous post, we demonstrated the mean-reverting and trending properties of SP500. We subsequently developed a trading system based on the mean-reverting behavior of the index. In this installment, we will develop a trend-following trading strategy.
Trend following or trend trading is a trading strategy according to which one should buy an asset when its price trend goes up, and sell when its trend goes down, expecting price movements to continue.
There are a number of different techniques, calculations and time-frames that may be used to determine the general direction of the market to generate a trade signal (forex signals), including the current market price calculation, moving averages and channel breakouts. Traders who employ this strategy do not aim to forecast or predict specific price levels; they simply jump on the trend and ride it. Due to the different techniques and time frames employed by trend followers to identify trends, trend followers as a group are not always strongly correlated to one another. Read more
We continue to use simple moving averages as noise filters in order to generate buy and sell signals. Recall that the SP500 index is trending in the long term, therefore we will use a long-term moving average along with a shorter one.
The trading rules are as follows,
If 3-day simple moving average > 200-day simple moving average, buy $10000 worth of stock
Exit if 3-day simple moving average < 200-day simple moving average
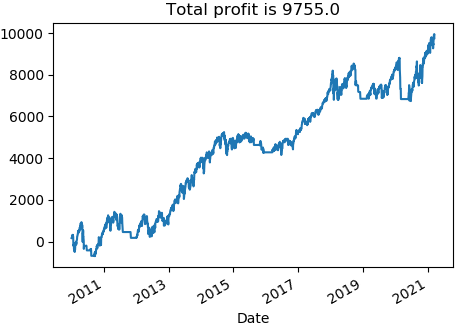
We downloaded SPY data from Yahoo Finance and implemented the above trading rules in a Python program. The picture below shows the equity line of the strategy. We note that using the 3- and 200-day simple moving averages the strategy is overall profitable.

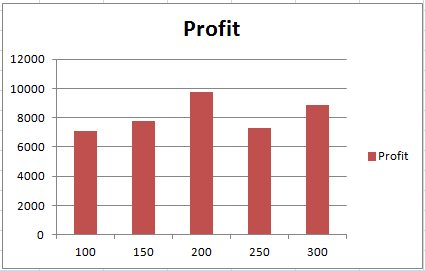
Next, we proceed to test the robustness of this system. To do so, we vary the length of the second moving averages (200 days in the above example). The graph below shows the total PnL as a function of the length of the second moving average. We observe that the overall profit remains positive when we change the length of the second moving average. This would indicate that the strategy performance is stable in this parameter regime.

In summary, we developed a simple trading strategy based on the trending property of the SP500 index. The strategy appears to be profitable and stable.
To download the accompanying Excel workbook or Python program for this post:
1. Subscribe to the newsletter. If you're already a subscriber, go to the next step
2. Once subscribed, refer a friend
After completing these steps, you’ll gain access to the file for this post, along with files for a dozen other posts.
Further questions
What's your question? Ask it in the discussion forum
Have an answer to the questions below? Post it here or in the forum


