In the previous installment, we presented a concrete example of pricing a European option. In this follow-up post we are going to provide an example of valuing American options.
The key difference between American and European options relates to when the options can be exercised:
- A European option may be exercised only at the expiration date of the option, i.e. at a single pre-defined point in time.
- An American option on the other hand may be exercised at any time before the expiration date. Read more
An exact analytical solution exists for European options. For American options, however, we have to use numerical methods such as Binomial Tree (i.e. Lattice) or approximations. The post entitled How to Price a Convertible Bond provides an example of the Binomial Tree approach.
The Binomial Tree model is an accurate one. However, its main drawback is that it’s slow. Consequently, several researchers have developed approximate solutions that are faster. In this example we’re going to use the Barone-Andesi-Whaley approximation [1].
The Barone-Adesi and Whaley Model has the advantages of being fast, accurate and inexpensive to use. It is most accurate for options that will expire in less than one year.
The Black-Scholes Model is appropriate for European options, that is, options that may be exercised only on the expiration date. The Barone-Adesi and Whaley Model is designed for American options, which are options that may be exercised at any time before they expire. The Barone-Adesi and Whaley Model takes the value computed by the Black-Scholes Model and adds the value of the early exercise option that is available on American option.. Read more

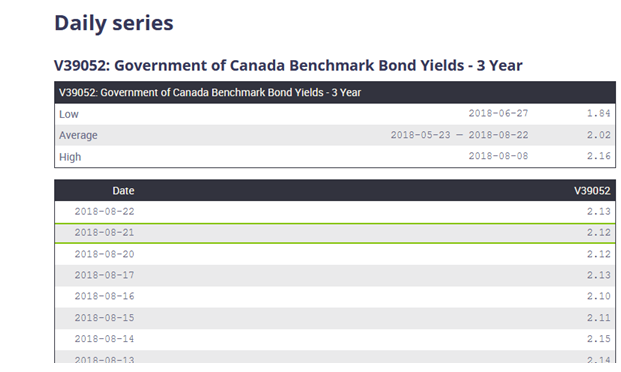
Government of Canada Benchmark Bond Yield. Source: Bank of Canada
Recall that the important inputs are:
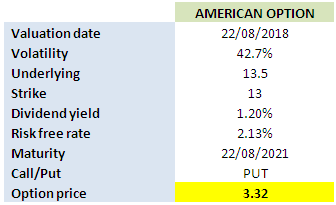
In this example we are going to use historical volatility. We retrieve the historical stock data from Yahoo finance. We then proceed to calculate the daily returns and use them to determine the annual volatility. The resulting volatility is 43%. Detailed calculation is provided in the accompanying Excel workbook.
Stock price
The stock price is also obtained from Yahoo finance. It is 13.5 as of the valuation date (Aug 22 2018).
The dividend yield is obtained from Yahoo finance. It is 1.2%. Note that for illustration purposes we use continuous instead of discrete dividend.
Interest rate
The risk-free interest rate is retrieved from Bank of Canada website. Since the tenor of the option is 3 years, we’re going to use the 3-year benchmark yield. It is 2.13% as at the valuation date.
We use the Excel calculator again and obtain a price of $3.32 for the American put option.

American option valuation in Excel
To download the accompanying Excel workbook or Python program for this post:
1. Subscribe to the newsletter. If you're already a subscriber, go to the next step
2. Once subscribed, refer a friend
After completing these steps, you’ll gain access to the file for this post, along with files for a dozen other posts.
References
Barone-Adesi, G. and Whaley, R.E. (1987) Efficient Analytic Approximation of American Option Values The Journal of Finance, 42, 301-320.
Further questions
What's your question? Ask it in the discussion forum
Have an answer to the questions below? Post it here or in the forum


