Follow us on LinkedIn
The volatility smile is a phenomenon observed in the options market where implied volatility tends to be higher for out-of-the-money (OTM) options compared to at-the-money (ATM) options. It refers to the graphical shape of the volatility curve, resembling a smile when plotted against the strike prices of options. The volatility smile suggests that options traders are willing to pay higher premiums for OTM options, indicating a higher perceived risk of extreme price movements in the underlying asset. This departure from a flat volatility curve challenges the assumptions made by the Black-Scholes option pricing model, which assumes constant and symmetric volatility across different strike prices.
Reference [1] proposed to use the new method developed by Carr and Wu in order to study the volatility smile of commodities. Specifically, the authors examined the volatility smile of the United States Oil ETF, USO. They pointed out,
In this paper, we study the information extracted from the no-arbitrage Carr and Wu (2020) formula based on a new option pricing framework in the USO option market and investigate the predictability of the information in forecasting the future USO returns. The risk-neutral variance and covariance estimates can be obtained from the no-arbitrage formula under the new framework. We document the term structure and dynamics of the risk-neutral estimates which lead to a “U”-shaped implied volatility smile with a positive curvature.
The figure below shows the volatility term structure for the United States Oil ETF,
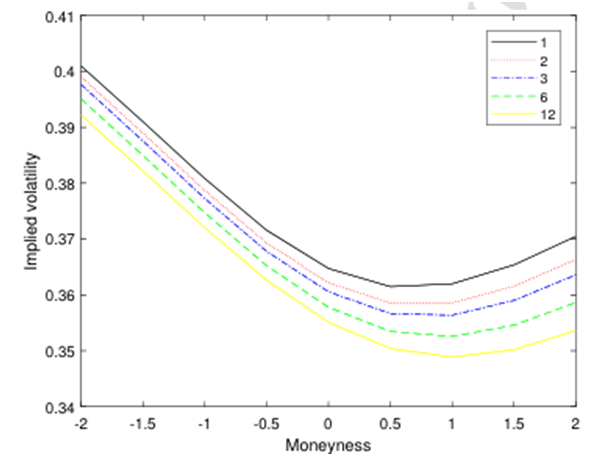
Volatility smile of the United States Oil ETF, USO
Usually, an equity index such S&P 500 exhibits a downward-sloping implied volatility pattern, i.e. a negative implied volatility skew. Oil, on the other hand, possesses a different volatility smile. This is because while equities are typically associated with crash risks, oil prices exhibit both sharp spikes and crashes, leading to a different implied volatility pattern. This highlights the importance of considering the specific characteristics and dynamics of different asset classes when analyzing and interpreting implied volatility patterns.
Let us know what you think in the comments below or in the discussion forum.
References
[1] Xiaolan Jia, Xinfeng Ruan, Jin E. Zhang, Carr and Wu’s (2020) framework in the oil ETF option market, Journal of Commodity Markets, Volume 31, September 2023, 100334
Further questions
What's your question? Ask it in the discussion forum
Have an answer to the questions below? Post it here or in the forum
My grandmothers had a 24-year age gap. Our relationships were different; I was closer with the older grandma, while the younger one seemed distant.
Since his campaign ended, DeSantis has barred homeless people from sleeping in public and prohibited kids from social media, among other things.

People with bipolar disorder are more sensitive to physical changes in the spring. This can trigger manic episodes.