Historical volatility (HV) is a useful measure to gauge market uncertainty. Recall that,
In finance, volatility (usually denoted by σ) is the degree of variation of a trading price series over time, usually measured by the standard deviation of logarithmic returns. Historic volatility measures a time series of past market prices… Investors care about volatility for at least eight reasons:
- The wider the swings in an investment’s price, the harder emotionally it is to not worry;
- Price volatility of a trading instrument can define position sizing in a portfolio;
- When certain cash flows from selling a security are needed at a specific future date, higher volatility means a greater chance of a shortfall;
- Higher volatility of returns while saving for retirement results in a wider distribution of possible final portfolio values;
- Higher volatility of return when retired gives withdrawals a larger permanent impact on the portfolio’s value;
- Price volatility presents opportunities to buy assets cheaply and sell when overpriced;
- Portfolio volatility has a negative impact on the compound annual growth rate (CAGR) of that portfolio
- Volatility affects pricing of options, being a parameter of the Black–Scholes model. Read more
Historical volatility is usually calculated by using the simple moving average of the historical returns. This approach works well when the market is in a “normal” condition. However, when there is a shock in the market, volatility increases and the equally weighted HV starts revealing its drawbacks, i.e.
- Historical volatility is not responsive enough to the increase in volatility;
- When the market stabilizes, the past volatile period still stays in the sample and is assigned an equal weight as the most recent period;
- When the volatile period goes out of sample in the calculation of historical volatility, we suddenly experience a drop in volatility that is not caused by changing market fundamentals.
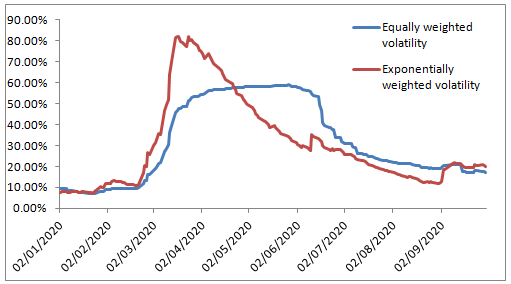
The picture below illustrates the above points. The blue line depicts the 3-month equally weighted historical volatility of SPY. As we can observe from the figure, when the SP500 went down in early March of 2020, the implied volatility (not shown) went up, but the equally weighted volatility was lagging. It started going up only a week later. By mid-June, the market started stabilizing, but the equally weighted historical volatility still exhibited a high value. And finally, the equally weighted HV dropped abruptly at the beginning of July.
To remedy these problems, one can use the Exponentially Weighted (EW) historical volatility that assigns bigger weights to the recent returns, and smaller weights to the past ones. The EW return variance is calculated as follows,
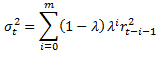
where λ is a weighting factor,
σt denotes volatility at time t,
m is the sample size, and
rt denotes the daily return at time t.
It is observed from the figure above that the EWHV (red line) is more responsive than the equally weighted historical volatility. Also, the decline of the EWHV from its peak is smoother than that of the equally weighted HV.
The equally and exponentially weighted historical volatilities were implemented in an Excel workbook.
To download the accompanying Excel workbook or Python program for this post:
1. Subscribe to the newsletter. If you're already a subscriber, go to the next step
2. Once subscribed, refer a friend
After completing these steps, you’ll gain access to the file for this post, along with files for a dozen other posts.
Also check out Historical Volatility Online Calculator.
Further questions
What's your question? Ask it in the discussion forum
Have an answer to the questions below? Post it here or in the forum