In the previous post, we discussed the close-to-close historical volatility. Recall that the close-to-close historical volatility (CCHV) is calculated as follows,

where xi are the logarithmic returns calculated based on closing prices, and N is the sample size.
A disadvantage of using the CCHV is that it does not take into account the information about intraday prices. The Parkinson volatility extends the CCHV by incorporating the stock’s daily high and low prices. It is calculated as follow,

where hi denotes the daily high price, and li is the daily low price.
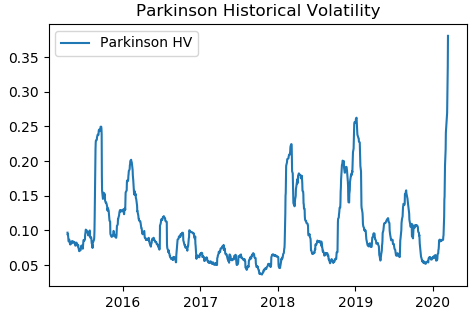
We implemented the above equation in Python. We downloaded SPY data from Yahoo finance and calculated the Parkinson volatility using the Python program. The picture below shows the Parkinson historical volatility of SPY from March 2015 to March 2020.

The Parkinson volatility has the following characteristics [1]
Advantages
- Using daily ranges seems sensible and provides completely separate information from using time-based sampling such as closing prices
Disadvantages
- It is really only appropriate for measuring the volatility of a GBM process. It cannot handle trends and jumps
- It systematically underestimates volatility.
To download the accompanying Excel workbook or Python program for this post:
1. Subscribe to the newsletter. If you're already a subscriber, go to the next step
2. Once subscribed, refer a friend
After completing these steps, you’ll gain access to the file for this post, along with files for a dozen other posts.
Also check out Historical Volatility Online Calculator.
References
[1] E. Sinclair, Volatility Trading, John Wiley & Sons, 2008
Further questions
What's your question? Ask it in the discussion forum
Have an answer to the questions below? Post it here or in the forum


