Follow us on LinkedIn
In a previous post, we touched upon a stock’s volatility through its beta. In this post, we are going to discuss historical volatilities of a stock in more details. If you want to use the online version, go to Historical Volatility Online Calculator.
Also referred to as statistical volatility, historical volatility gauges the fluctuations of underlying securities by measuring price changes over predetermined periods of time. It is the less prevalent metric compared to implied volatility because it isn’t forward-looking.
When there is a rise in historical volatility, a security’s price will also move more than normal. At this time, there is an expectation that something will or has changed. If the historical volatility is dropping, on the other hand, it means any uncertainty has been eliminated, so things return to the way they were. Read more
There are various types of historical volatilities such as close-to-close, Parkinson, Garman-KIass, Yang-Zhang, etc. These volatility measures play an important role in trading and risk management. In this post, we will discuss the close-to-close historical volatility.
The close-to-close historical volatility (CCHV) is calculated as follows,
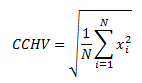
where xi are the logarithmic returns calculated based on the stock’s closing prices, and N is the sample size. In this example, N=22, the average number of trading days in a month.
We implemented the above equation in Python. We downloaded SPY data from Yahoo finance and calculated CCHV using the Python program. The picture below shows the close-to-close historical volatility of SPY from March 2015 to March 2020.
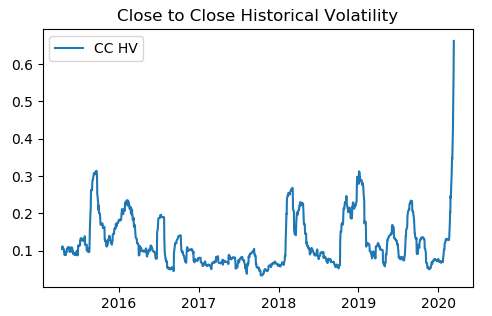
It’s observed that the volatility is a mean-reverting process. The CCHV has the following characteristics [1]
Advantages
- It has well-understood sampling properties
- It is easy to correct bias
- It is easy to convert to a form involving typical daily moves
Disadvantages
- It is a very inefficient use of data and converges very slowly
References
[1] E. Sinclair, Volatility Trading, John Wiley & Sons, 2008
Further questions
What's your question? Ask it in the discussion forum
Have an answer to the questions below? Post it here or in the forum