Follow us on LinkedIn
In a previous post, we presented an example of volatility analysis using Close-to-Close historical volatility. In this post, we are going to use the Generalized Autoregressive Conditional Heteroskedasticity (GARCH) model to forecast volatility.
In econometrics, the autoregressive conditional heteroscedasticity (ARCH) model is a statistical model for time series data that describes the variance of the current error term or innovation as a function of the actual sizes of the previous time periods’ error terms; often the variance is related to the squares of the previous innovations. The ARCH model is appropriate when the error variance in a time series follows an autoregressive (AR) model; if an autoregressive moving average (ARMA) model is assumed for the error variance, the model is a generalized autoregressive conditional heteroskedasticity (GARCH) model.
ARCH models are commonly employed in modeling financial time series that exhibit time-varying volatility and volatility clustering, i.e. periods of swings interspersed with periods of relative calm. ARCH-type models are sometimes considered to be in the family of stochastic volatility models, although this is strictly incorrect since at time t the volatility is completely pre-determined (deterministic) given previous values. Read more
As an example, we are going to apply the GARCH model to the SP500. We first downloaded 5 years of historical data of SPY from Yahoo Finance. Next, we used the first 4 years of data as the training set and fit the data to the GARCH (1, 1) model. The Python ARCH program returned the following model parameters,
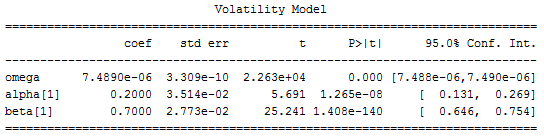
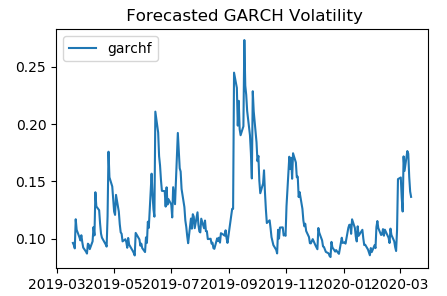
After obtaining the parameters, we applied the model to the remaining 1 year of data and calculated the forecasted volatility on a rolling window of 1 month. The picture below shows the rolling forecasted volatility,
Further questions
What's your question? Ask it in the discussion forum
Have an answer to the questions below? Post it here or in the forum
The Princess of Wales will present the trophy to either last year's winner, Carlos Alcaraz, or seven-time Wimbledon champion, Novak Djokovic.


Hello, when I try to run the script, I am met with a type error which I will leave below. Also, pd.Dataframe.from_csv() has been deprecated and is now pd.read_csv().
TypeError: cannot do slice indexing on RangeIndex with these indexers [2015-03-16] of type str
This is using the original CSV and changing none of the code.
1-yes, pd.read_csv should be used
2-I guess it’s due to version. Let me look into this. Are you using 3.8?
I am having the same error in Python 3.8:
File “C:\Users\….\anaconda3\lib\site-packages\pandas\core\indexes\base.py”, line 5309, in _validate_indexer
raise self._invalid_indexer(form, key)
TypeError: cannot do slice indexing on RangeIndex with these indexers [2015-03-16] of type str
This is using the original CSV and changing none of the code.
I checked out the script, this doesn’t seem to be a forecast but a test set fitted model using the previous estimated model parameters?
I believe the arch library has a forecast ability. https://bashtage.github.io/arch/univariate/univariate_volatility_forecasting.html
Is there an updated code for a rolling forecast?
The model is fitted using data from March 2015 to March 2019, then a rolling 22-days forecasted volatility is calculated from March 2019 to March 2020