Follow us on LinkedIn
Technical trading is a method of evaluating and making trading decisions based on the historical price and volume patterns of a security or financial instrument. It operates on the premise that past price movements and trading activity can provide insights into future market behavior. Practitioners of technical trading use a variety of tools and indicators, such as moving averages, support and resistance levels to identify trends, potential entry and exit points, and the overall strength or weakness of a security.
Reference [1] conducted a study on the profitability of technical trading rules in the US equity index market. The study focuses on assessing the profitability of trading range breakout (TRB) trading rules and widely employed moving average (MA) trading rules within the NDX 100 and S&P 500 indices. The authors pointed out,
First, TRB rules can be effective in capturing momentum in various financial markets and asset classes. Research has shown that momentum strategies, including TRB, can be profitable in various markets and asset classes. In addition, TRB can be an effective trading strategy for capturing momentum in various markets and asset classes…
Second, the profitability of TRB trading rules varies depending on the asset class (i.e., financial instruments tracking NDX 100 and S&P 500 indices) and trading period (i.e., the first 10-year period and the second 10-year period). Our study found that the NDX index outperformed the S&P 500 index when holding long positions. The revealed results using TRB trading rules were much better than those using MA trading rules…
Third, we argue that big data analytics can be used to scrutinize the black box of breakout trading strategies and determine their effectiveness. Researchers were able to obtain a wide variety of trading signs generated by TRB and MA rules from a long-term dataset of two stock indices due to the growing prevalence of big data analytics in various disciplines, including finance. Based on our findings, investors may be able to increase their stock market profits using big data analytics.
In summary, the authors demonstrated the effectiveness of range breakout-based technical trading in the S&P500 and NDX. Importantly, this approach outperforms trading rules grounded in moving averages. An interesting finding is that when prices decline, the trading strategy involves buying shares rather than selling. This aligns with the observation that the index market tends to mean-revert, particularly on the downside, and displays an upward bias.
Let us know what you think in the comments below or in the discussion forum.
References
[1] Min-Yuh Day, Yensen Ni, Be greedy when others are fearful: Evidence from a two-decade assessment of the NDX 100 and S&P 500 indexes, International Review of Financial Analysis, Volume 90, November 2023, 102856
Further questions
What's your question? Ask it in the discussion forum
Have an answer to the questions below? Post it here or in the forum
Meta rolled back January 6-era restrictions on former President Donald Trump's social media accounts ahead of the Republican National Convention.


June saw 75 filings, up from 62 in May and above the pandemic-era peak of 74 in July 2020, according to S&P Global Market Intelligence.

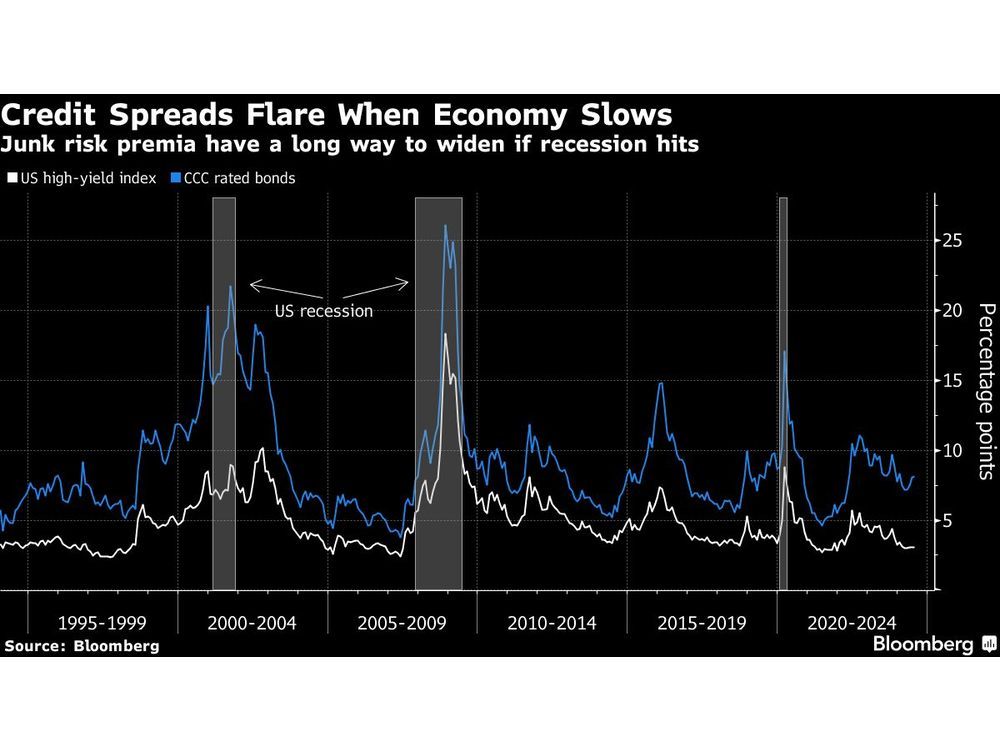
Credit markets are breathing a sigh of relief after inflation data showed price pressures are cooling broadly, but a weakening economy poses fresh risks to corporate debt.